A Trend Line Is a Story with Its Assumptions Showing
A trend line carries assumptions about what stays constant. Learn to expose them so a projection becomes a clearer prompt for decisions, not a promise.
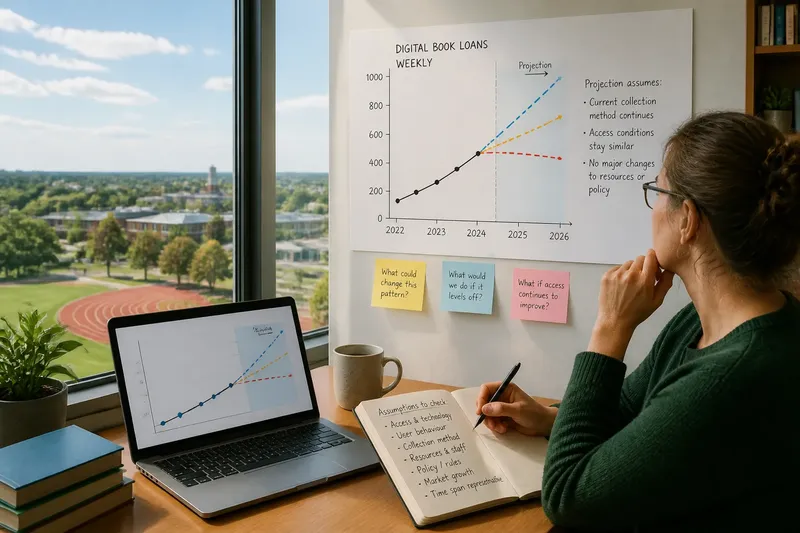
The common mistake with a trend line is to treat its smooth extension as a forecast that speaks for itself. A trend line is a story with its assumptions showing: it takes a pattern visible now and carries it forward, while quietly deciding what will stay much the same. Make those decisions explicit, and the line becomes a useful prompt for thought rather than a claim about what must happen.
What does a trend line actually say?
A trend line summarises how a measured quantity has changed across a chosen period. Extending it into the future says, in effect: “If the pattern continues in a similar way, this is the path the quantity could follow.” The word if does the essential work.
The line does not explain why the pattern occurred, nor does it establish that the forces behind it will continue. A rising line for online orders, for instance, might reflect wider access, a temporary shift in behaviour, or a change in how orders are recorded. The same visible slope can sit on top of different explanations, and each explanation suggests different reasons for expecting continuation.
It also matters what was measured. A total, an average, a rate and a share answer different questions. A growing total can coexist with a falling share if the whole market is growing faster. Before extending any line, name the quantity and the population or area it describes.
Which assumptions are hidden in the extension?
Every projection carries choices about the conditions behind the observed pattern. Some are mathematical, such as extending a straight line rather than a curve. Others concern the world: whether the people, rules, resources and incentives shaping the pattern will remain similar.
Ask what must stay stable for the line to make sense. Consider whether:
- The same people or organisations are included in the measure.
- The definition and collection method remain consistent.
- Important constraints, such as staff, space or materials, do not change sharply.
- People’s behaviour and incentives remain broadly similar.
- Rules, technology or access do not alter the pattern’s underlying causes.
- The chosen time span is representative rather than dominated by an unusual disruption.
These are not reasons to discard a projection. They show what it depends on. A trend can be useful even when some conditions may change, provided the reader knows which ones matter and can ask what would happen if they did.
Why does the chosen time span change the story?
A line drawn over a short period may capture a temporary surge or interruption. A longer period may include a different pattern, or combine several changes that no longer operate in the same way. Neither span is automatically the right one; each frames the question differently.
Look at the underlying observations as well as the fitted line. Do the points broadly follow a steady direction, or does the line conceal reversals and clusters? If a single unusual period strongly affects the slope, say so. Where the data permit, compare a few sensible time spans and explain how the projected direction changes. This is a way to examine sensitivity, not a contest to find the most attractive line.
The form of the line matters too. A straight extension assumes a constant absolute change over each interval. A curved extension may imply that change accelerates or slows. Choosing a curve requires its own explanation; a better visual fit to past points is not, by itself, a reason to expect the same curve to continue.
How can a projection be made easier to question?
Put the measured series and its extension in view together, and mark where recorded observations end. Label the vertical quantity, its units and the time intervals. Use a distinct style for the projected portion so that a reader can see the boundary between what has been observed and what has been carried forward.
Add a short note beside the line describing its main conditions. “Assumes the current collection method and rate of change continue” is more informative than “based on current trends”. If a known constraint or change could alter the pattern, name it as a condition to watch rather than hiding it in a footnote.
Say you manage a library network and have plotted the number of weekly digital-book loans over recent terms. Imagine the line rises steadily, but a new reading app has just made borrowing easier. If you extend the old line without comment, readers may mistake recent access conditions for a lasting pattern. You could instead label the extension as conditional on access remaining similar, then ask how the projection would change if the app’s effects continue or level off. The visible result is a line that invites a specific question, not a promise about future borrowing.
How should uncertainty appear on the chart?
A single line can look more certain than the reasoning behind it. If the charting method supports a range, show it and explain what the range represents. It may reflect uncertainty in the estimated relationship, but it does not automatically include every possible change in policy, behaviour or resources. Keep those limits clear.
If a formal range is not available, use a small set of clearly labelled extensions based on different stated assumptions. For example, one may hold the recent rate steady while another allows it to ease. Do not present these as a menu of equally likely outcomes unless there is a sound reason to do so. Their purpose is to show how the result depends on the conditions chosen.
Use plain language in captions and discussion. “The line extends the recent pattern” distinguishes projection from observation. “The quantity will reach this point” does not. The wording should not sound more definite than the method can support.
What should readers ask about a trend line?
Does a trend line predict what will happen?
No. It extends a selected pattern under stated or unstated conditions. It can help frame a question, but it cannot establish that those conditions will continue.
Why can two trend lines use the same data but point to different futures?
They may use different time spans, mathematical forms or assumptions about continued change. Ask what each choice means before comparing the resulting extensions.
When should an old trend line be revised?
Revisit it when the measure changes, a major condition shifts, or new observations no longer resemble the pattern it extends. Record what changed so readers can see why the projection was updated.
Can a trend line still help when the future is uncertain?
Yes, if its role is to make a condition visible rather than settle a prediction. It can show what follows from continuity and help identify which assumption deserves attention.
How can the line support a better decision?
Use the projection to identify a dependency, then ask whether a decision should rely on that dependency. If a plan works only if a recent rise continues, make that condition part of the discussion. If it remains workable under a slower trend, that is a different and useful observation.
A trend line is rather like a ruler laid along a path: it can help you see the direction and distance implied by the route already taken, but it cannot tell you whether the path ahead is clear. Before using a trend line, state what is measured, where the observations stop, which conditions are being carried forward and what change would make the extension worth revisiting. That small act of disclosure turns a smooth stroke into an honest tool for thinking.